Behind the data
.png)
.png)
When creating the Reewild app, one of the challenges we faced was ensuring the availability and accuracy of food carbon footprint data, to inform and not mislead users. To that end, we've developed a transparency scale to disclose the sources of our data, the variation in accuracy, and how our methodology serves as a feedback loop to improve accuracy as we scale. We follow a "good over perfect" principle, which acknowledges the limitation of existing data, but strives to provide consumers with the most comprehensive database of carbon scored products on the market.
Today, our app acts as a central repository that pulls together all available carbon data on food and drink products into one database and harmonises it to the same system boundaries. Where data on certain food products has yet to be made available, we have carried out estimated carbon scoring, underpinned by databases comprised of thousands of peer-reviewed scientific studies. This approach provides our users with a uniquely comprehensive dataset, helping them to understand and compare the impact on any product on the market.
As a climate transparency platform, we encourage brands to conduct accurate carbon calculations through our best-in-class carbon accounting partners, and invite them to join our climate transparent community.
The carbon accounting calculators we work with all use similar methodologies, and follow the standards set out by ISO14040 and GHG Protocol. In most cases, the carbon scores are calculated using a combination of primary and secondary data. All the scores in our platform use the same system boundaries - factoring in the emissions from cradle to grave.
The products for which we have estimated the carbon scores, due to a lack of available information, are clearly sign-posted as being low accuracy and deprioritised vs higher accuracy products. This also serves to challenge and incentivise these brands to disclose their climate impact.
.png)
As more brands conduct primary LCAs, consumers are given a more accurate picture of food product carbon footprints. This also creates a collaborative circle of data collection, providing greater insight into different supply chains and life-cycles. By collecting more primary data, it creates a positive loop that feeds into the bottom end of carbon emissions data, making general estimations at the “low” end more and more accurate. This loop results in more cost-effective ways for businesses to calculate accurately, while also providing consumers with better insights into how to reduce their carbon footprint.
This is the lowest level of data accuracy in our database. For these products we have had to estimate the weight of each component ingredient, due to a lack of more accurate publicly available data. Each ingredient has then been matched to our open source carbon footprint database - an aggregate of ADEME’s Agribalyse data, Poore & Nemecek (2018) data, and Clune (2017) data. With these generalised scores, we will allow users to actively challenge the relevant brands to provide greater transparency on the climate impact of their products.
Low accuracy scores are generic ratings based on the product sub-type. These scores are attributed to branded products for which we lack comprehensive data. As such, a Chocolate Magnum would carry the carbon score for a generic “Packaged Ice cream on stick, with chocolate coating ”. The majority of these generic scores in our database derive from ADEME's Agribalyse database.
.png)
Moderate accuracy scores are given to products and recipes that are carbon scored in real time using the Reewild Foodprint Calculator (generally under 5 seconds). To do so, we leverage the power of generative AI to find an estimated serving size and a weighted ingredient list for the specific product/recipe. Using our proprietary matching system, we then assign carbon footprint values to each ingredient, drawing from three databases: Foodsteps platform data (2023), ADEME’s Agribalyse data, and Poore & Nemecek (2018) data. An overall product/recipe carbon score is then calculated by summing the ingredient carbon values. These scores are subsequently saved in our system to enable users to access them more rapidly in the future. These scores are of greater accuracy than simply matching to a generalised Agribalyse datapoint (Medium Category), as they take each ingredient into account with more accurate weight measurements.
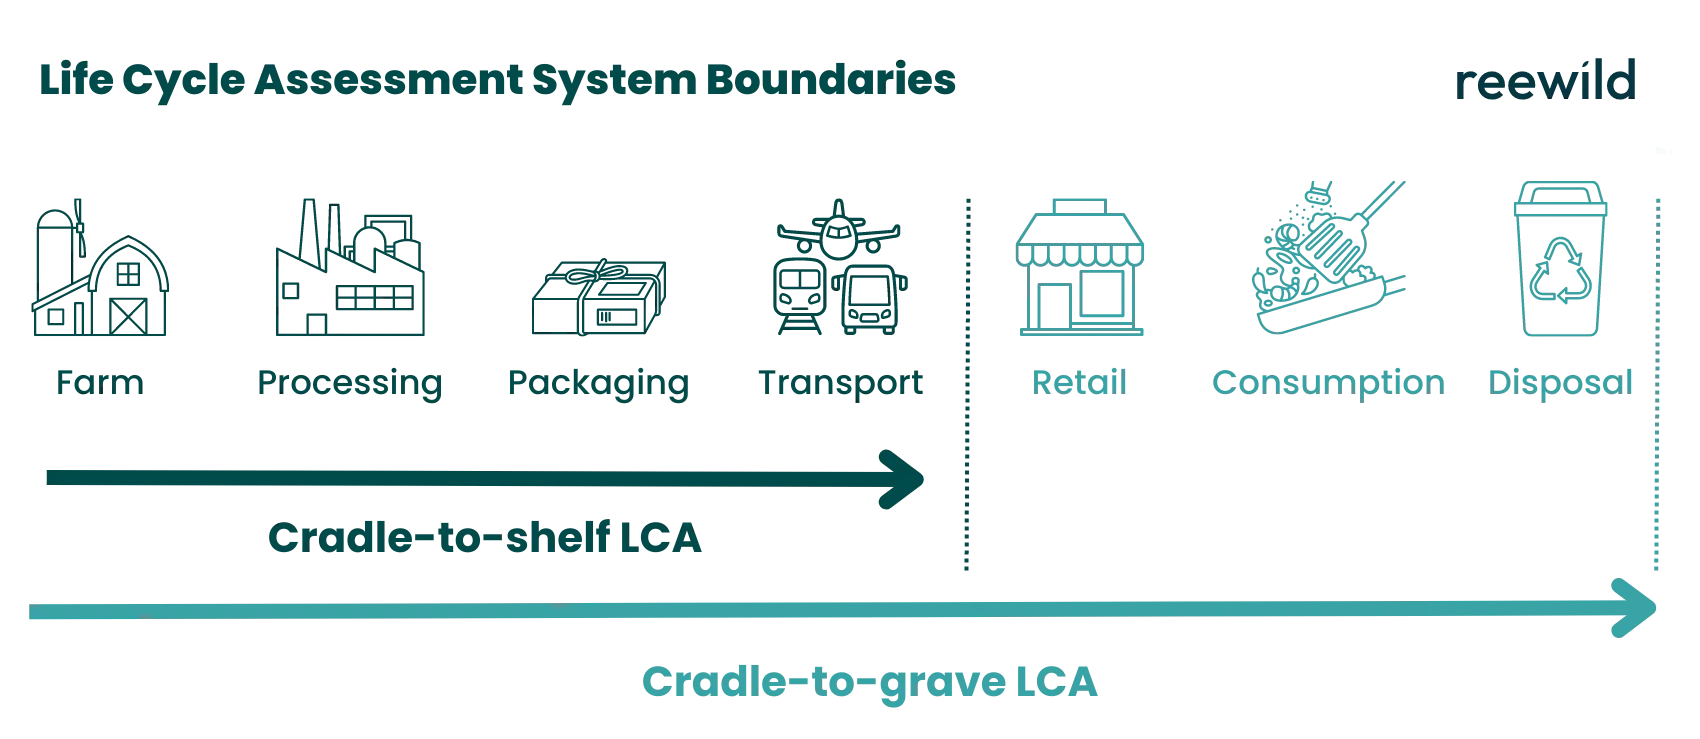
Medium accuracy scores are attributed to products and recipes that have undergone a “cradle-to-shelf” Life Cycle Assessment (LCA). This study only takes into account a product's carbon emissions up until the point of sale. To harmonise the data within our app, and ensure comparability between products, we have estimated the emissions associated with its final stages, including its consumption and disposal. The accuracy of the score is therefore diminished. These products are, however, produced by responsible brands who have decided to be transparent about their carbon emissions.

LCAs can be conducted along different lengths of a recipe or a product's supply chain, with the two most common being cradle-to-shelf and cradle-to-grave. Products with high accuracy scores are backed by data collected and assessed through a cradle-to-grave LCA. These scores take into account a product's entire lifecycle, including its farming, processing, transport, packaging, retail, consumption, and disposal. These products are sold by brands who are committed to full climate transparency.
These are the most accurate scores in our database, as the products have undergone a rigorous bespoke LCA. This is the gold standard of carbon footprinting. These brands have committed to collecting primary data, through a detailed analysis of each product’s unique lifecycle and supply chains. Products in this category use a methodology that is aligned with the European Commission’s Product Environmental Footprint (PEF).

Our customer support team is ready to help, whatever you business needs.
.png)
Our excellent customer support team is ready to help.

Be the first to get expert insights straight to your inbox

 Your payment was processed successfully. Congratulations!
 You have cancelled the payment process.
 This popup does not exist. I'm sorry.